So the following is just me trying out my programing skills. So there are sure to be some mistakes. But it looks ok so far.
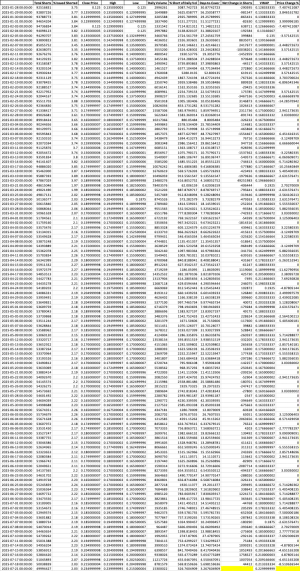
So here is what I could scrape:

So that is the Data.
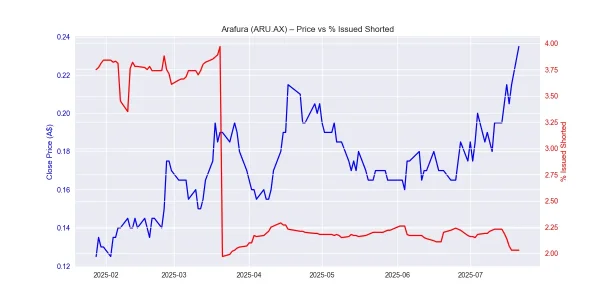
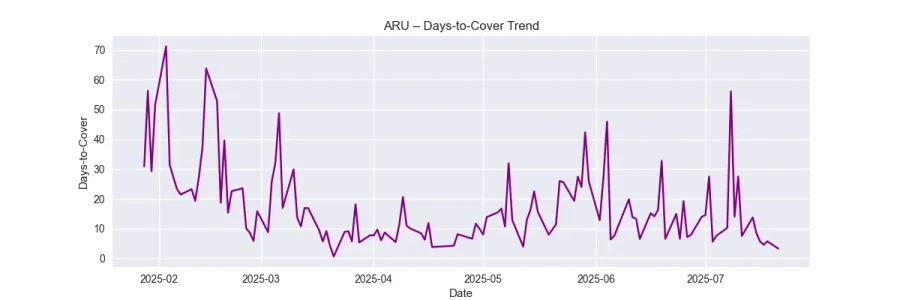
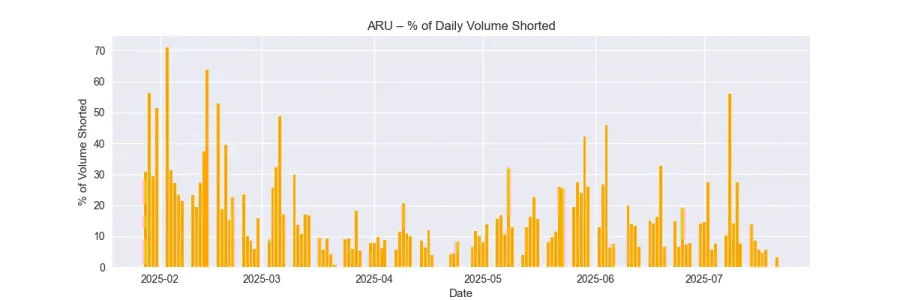
Here are the graphs:


o what does it all mean? Here’s the story that emerges from this dataset:
1. Early Period (Late Jan to Early Feb)
What do you guys think? Seems about right...
So here is what I could scrape:

So that is the Data.
Here are the graphs:


o what does it all mean? Here’s the story that emerges from this dataset:
1. Early Period (Late Jan to Early Feb)
- Price Range: ~0.125 → 0.145
- Short Interest: rising steadily from ~92M to ~95M shares.
- % Issued Shorted: ~3.7–3.8% → moderately high.
- Volume Spikes: occasional high-volume days, with Days-to-Cover (DtC) often >20–50, meaning liquidity was thin relative to the short position.
- Story: Shorts were adding slowly, but the price didn’t collapse. It oscillated within a tight band, suggesting either controlled selling pressure or accumulation from long buyers absorbing supply.
- Feb 6–14: Price tested 0.14–0.15, volumes spiked to 4M+, short interest jumped, but DtC fell as liquidity improved.
- There’s a sharp drop on Feb 19 (~-7% intraday), but it bounced back by Feb 21.
- Narrative: Shorts likely tried to push the price lower, but strong buying supported the stock around 0.14.
- Feb 25–27: Price explodes from 0.15 → 0.175–0.185, and volume surges >15M.
- Shorts covered: net reduction in shorts, dropping from ~95M → ~91M.
- Days-to-Cover plummeted (showing massive liquidity).
- Story: Likely news-driven spike or a short squeeze. Shorts were forced to cover as volume/liquidity surged.
- After peaking ~0.185, the stock retraced to ~0.16–0.17.
- Shorts rebuilt positions, climbing again toward ~94M shares.
- Volume dropped back to 3–5M daily, meaning buying pressure cooled.
- Narrative: Post-news hangover. Traders locked in gains. Shorts took advantage of fading momentum.
- March 20: Volume explodes to 23M+, price pushes to 0.20+, but short interest collapses by ~50% overnight (from ~97M → ~48M).
- Days-to-Cover drops from ~4.1 → 0.6.
- Narrative: MASSIVE short covering day → likely a big catalyst (deal? announcement?) forcing shorts to flee.
- After the big squeeze:
- Shorts stabilize ~50M (only ~2.2% of issued shares).
- Price grinds between 0.18–0.20.
- Volume normalizes, moderate swings but no breakout.
- Narrative: Market digests the news. Shorts are cautious. No new catalyst yet.
- Shorts start creeping back up (~55M by end of June).
- Price stays range-bound 0.16–0.18, suggesting accumulation or quiet selling.
- Narrative: The market has cooled; traders are waiting for the next trigger.
- July 4–21:Price surges again:
- 0.18 → 0.23–0.24.
- Volume rises again (10–15M).
- Shorts drop further (~53M → ~50M → ~49M).
- Narrative: Another bullish wave, possibly second news catalyst → shorts exit gradually.
- Jan–Feb: Steady short build, controlled selling.
- Late Feb: Short squeeze & spike (~0.15 → 0.18+).
- March: Sharp event-driven squeeze (volume 20M+, shorts halve overnight).
- Apr–May: Sideways consolidation, shorts cautious.
- June: Shorts quietly rebuild, price compresses.
- July: Second breakout toward 0.24 with shorts exiting.
- This looks like where shorts try to suppress the price between catalysts.
- Each news/catalyst triggers massive volume, forcing shorts to cover.
- There’s a cyclical patternof:
- Shorts build → price stagnates
- Catalyst arrives → spike → shorts cover → consolidation → repeat.
What do you guys think? Seems about right...